Scheduled Walmart pipelines
Walmart Connect reports pulled on a schedule, with retries and alerts when a report is late or changes shape.
Walmart Connect
Walmart is growing fast for brands and agencies, but its reporting doesn't line up with Amazon's. We pull Walmart Connect data on a schedule and map it into the same model, so you can compare retailers like for like.
 Walmart ConnectSponsored Products · Item-level sales · Agency accounts
What we pull
Pulled through the platform's API on a schedule, landed in your warehouse, and kept up to date.
Example mapping
The same fields every other platform has, under different names and rules. Here is how we line them up.
| Concept | Walmart Connect field | In your model | What we do |
|---|---|---|---|
| Spend | adSpend | spend_usd | Kept in the account currency, then converted |
| Attribution window | attributedSales3days / 14days / 30days | attributed_sales + attribution_window | 3, 14 or 30 days, kept and labeled |
What we build
Walmart Connect reports pulled on a schedule, with retries and alerts when a report is late or changes shape.
Walmart mapped into the same schema as Amazon and other retail media networks, with each retailer's attribution rules kept and labeled.
Spend, ROAS and share of spend by retailer, brand and product, in Looker, Looker Studio, Power BI or Tableau.
Alerts when Walmart ROAS drops, spend spikes or a keyword starts wasting budget.
Results
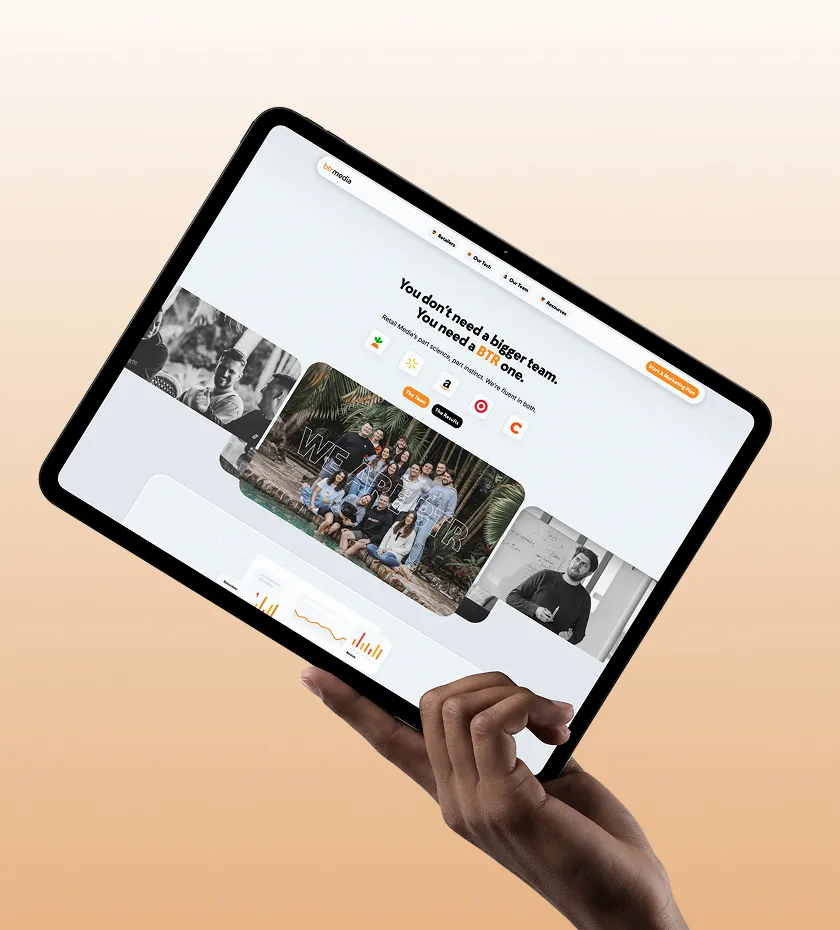
We built ETL pipelines into one data model and one dashboard for Amazon, Walmart and Instacart campaigns.
Read the case study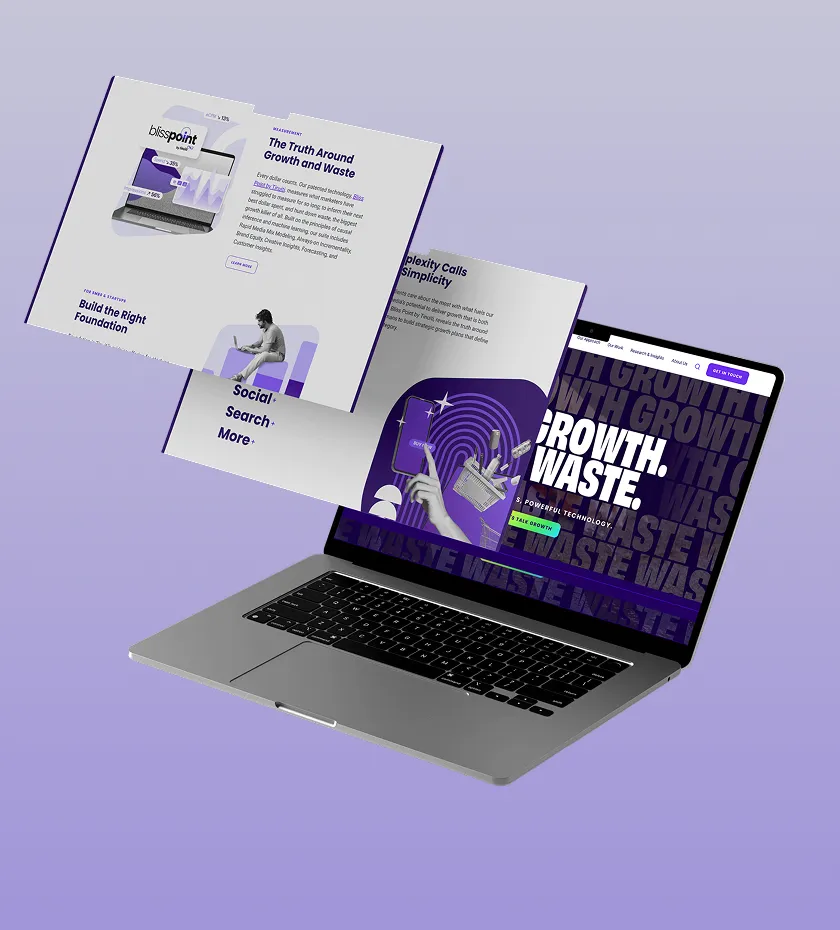
We rebuilt the ETL, warehouse and automation layer across Amazon, Walmart, TikTok, Instacart and Criteo.
Read the case studyFAQ
Yes, as long as the differences are visible. We put both retailers in one model, keep each one's attribution window and labeling, and show a blended view using a rule you agree on.
Tell us which accounts you run and where the numbers stop matching. An engineer will tell you what we'd fix first.