Case study

Mau Brands

A data-driven E-commerce analytics platform designed to help Amazon brands optimize performance, manage inventory, and make faster business decisions.

25% Less Reporting TimeAmazon
Mau Brands case study hero
Client
Mau Brands
Industry
Amazon marketplace · E-commerce analytics
Duration
Ongoing partnership
Services
Data engineering, Analytics platform, Inventory intelligence, Advertising insights

About the project

Mau Brands is an ecommerce analytics and operations platform designed to give Amazon sellers and agencies complete visibility into their business performance.

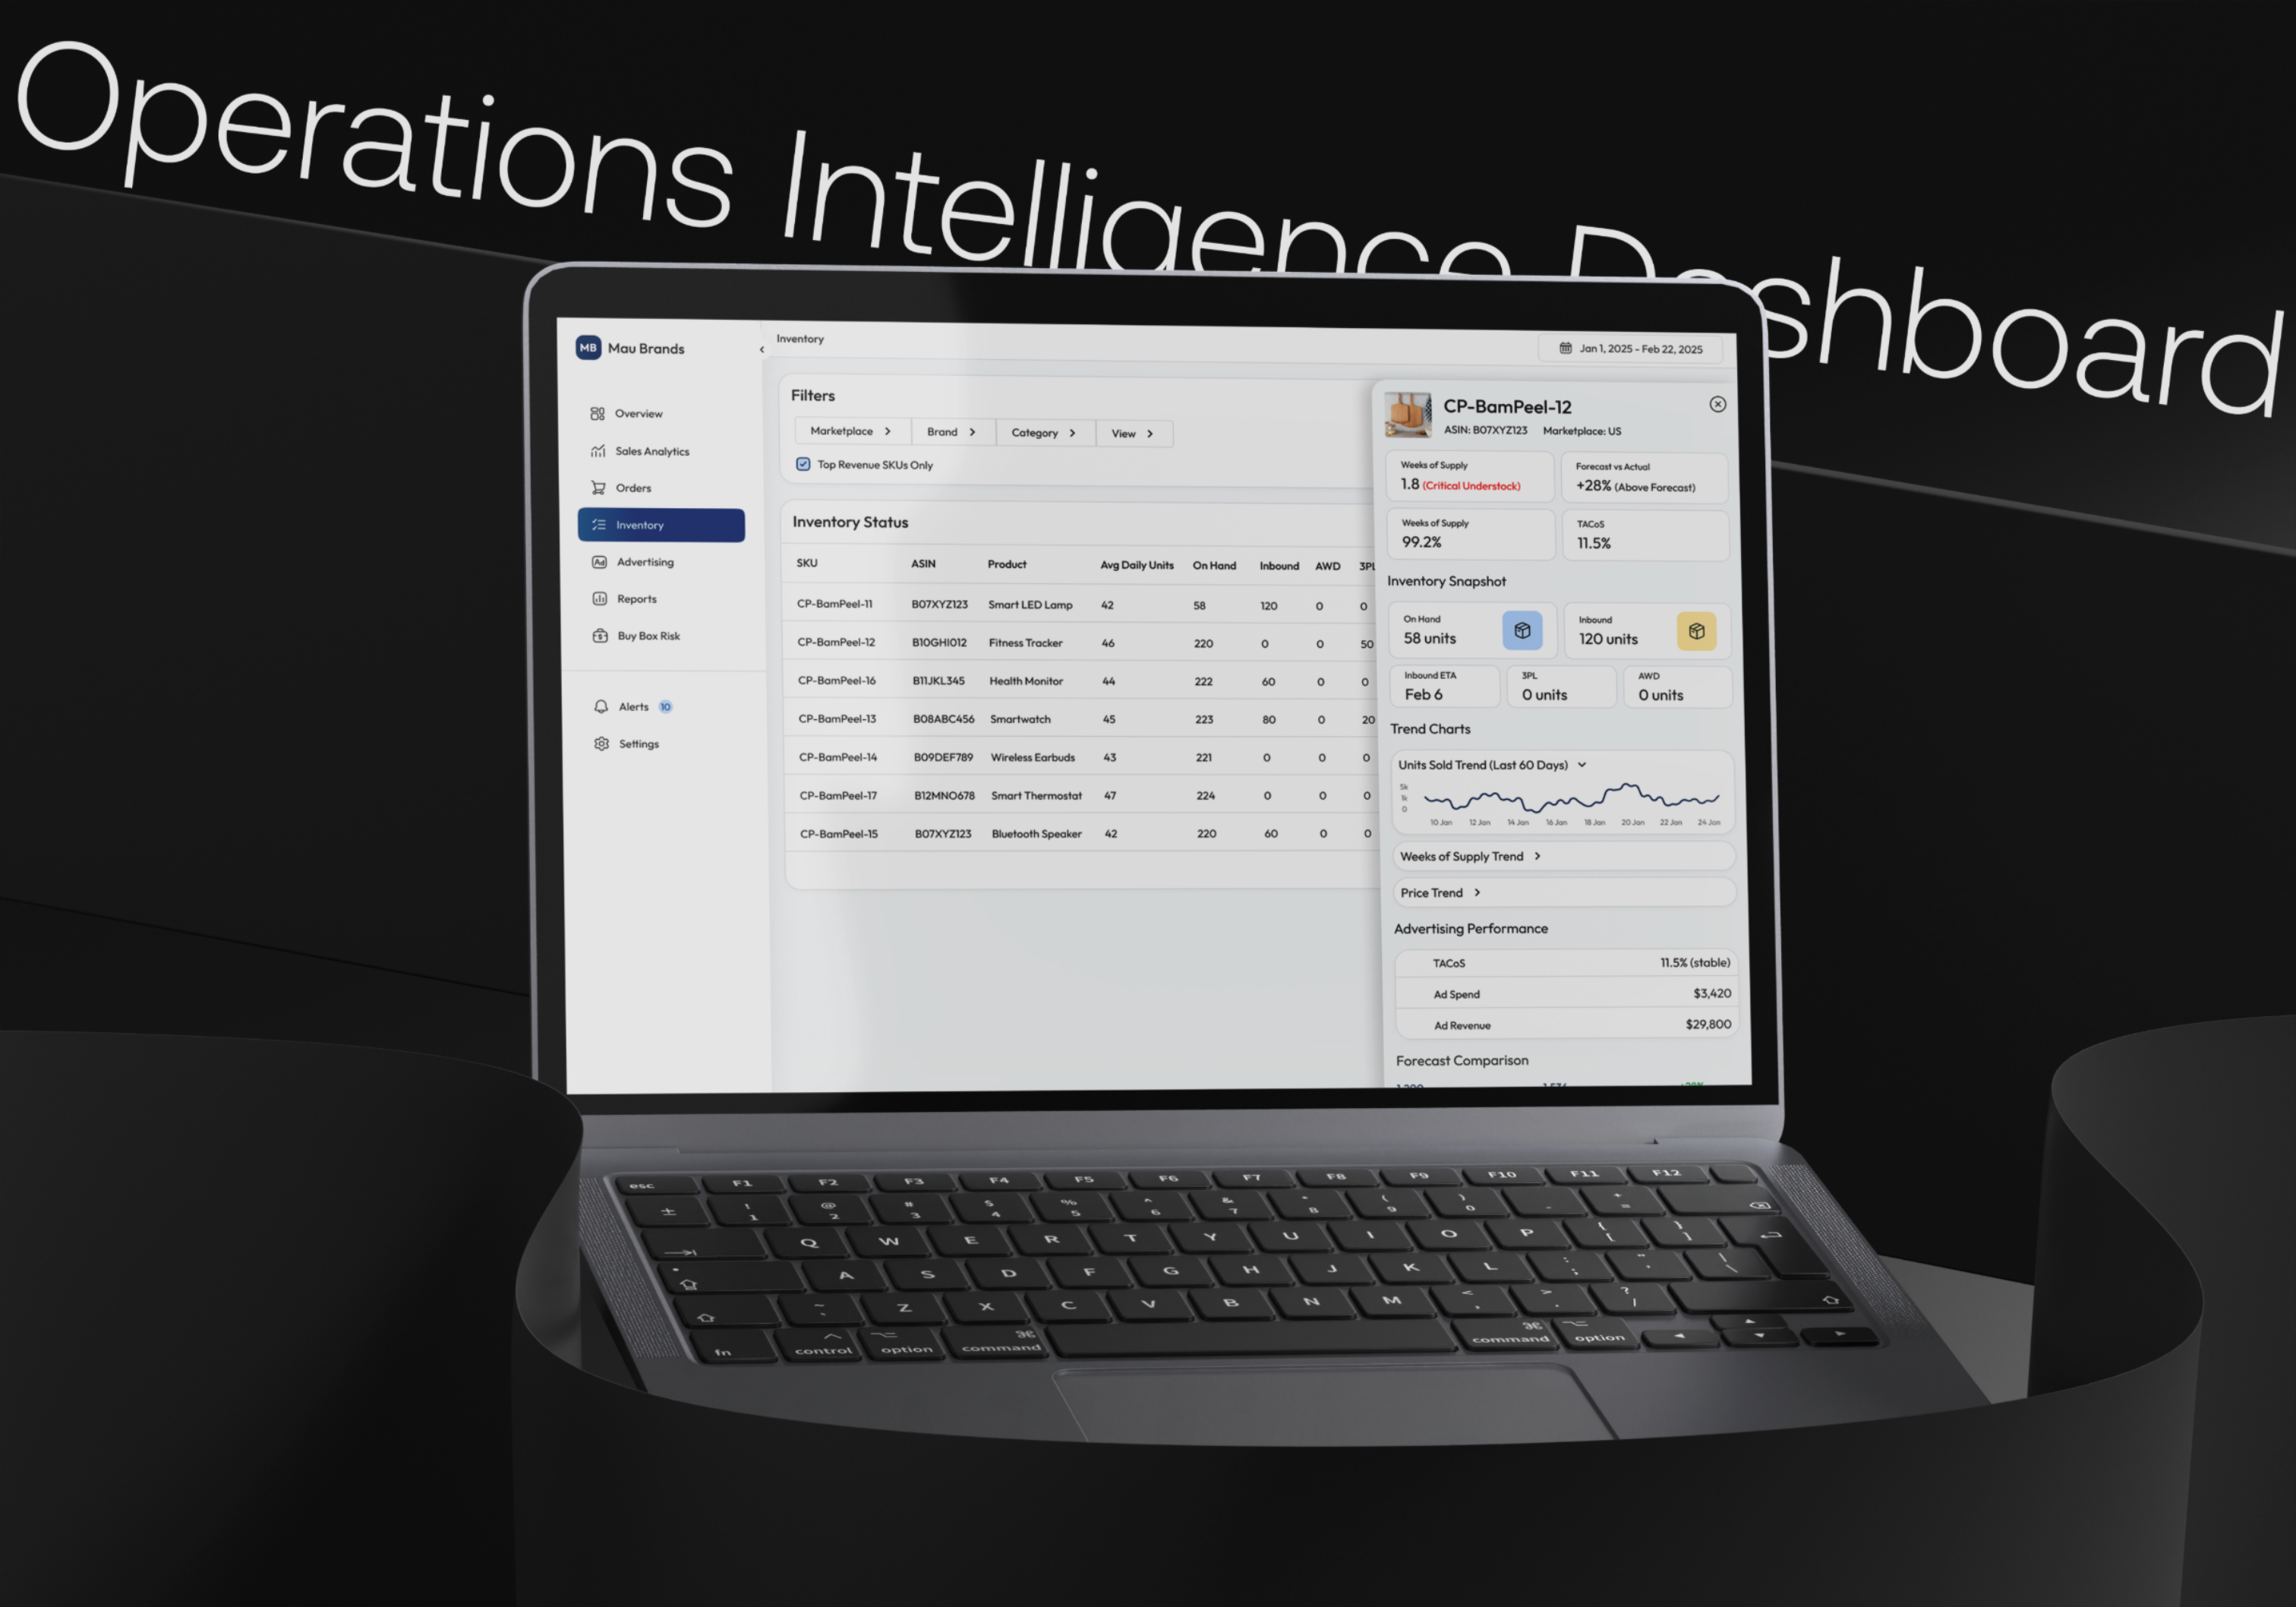
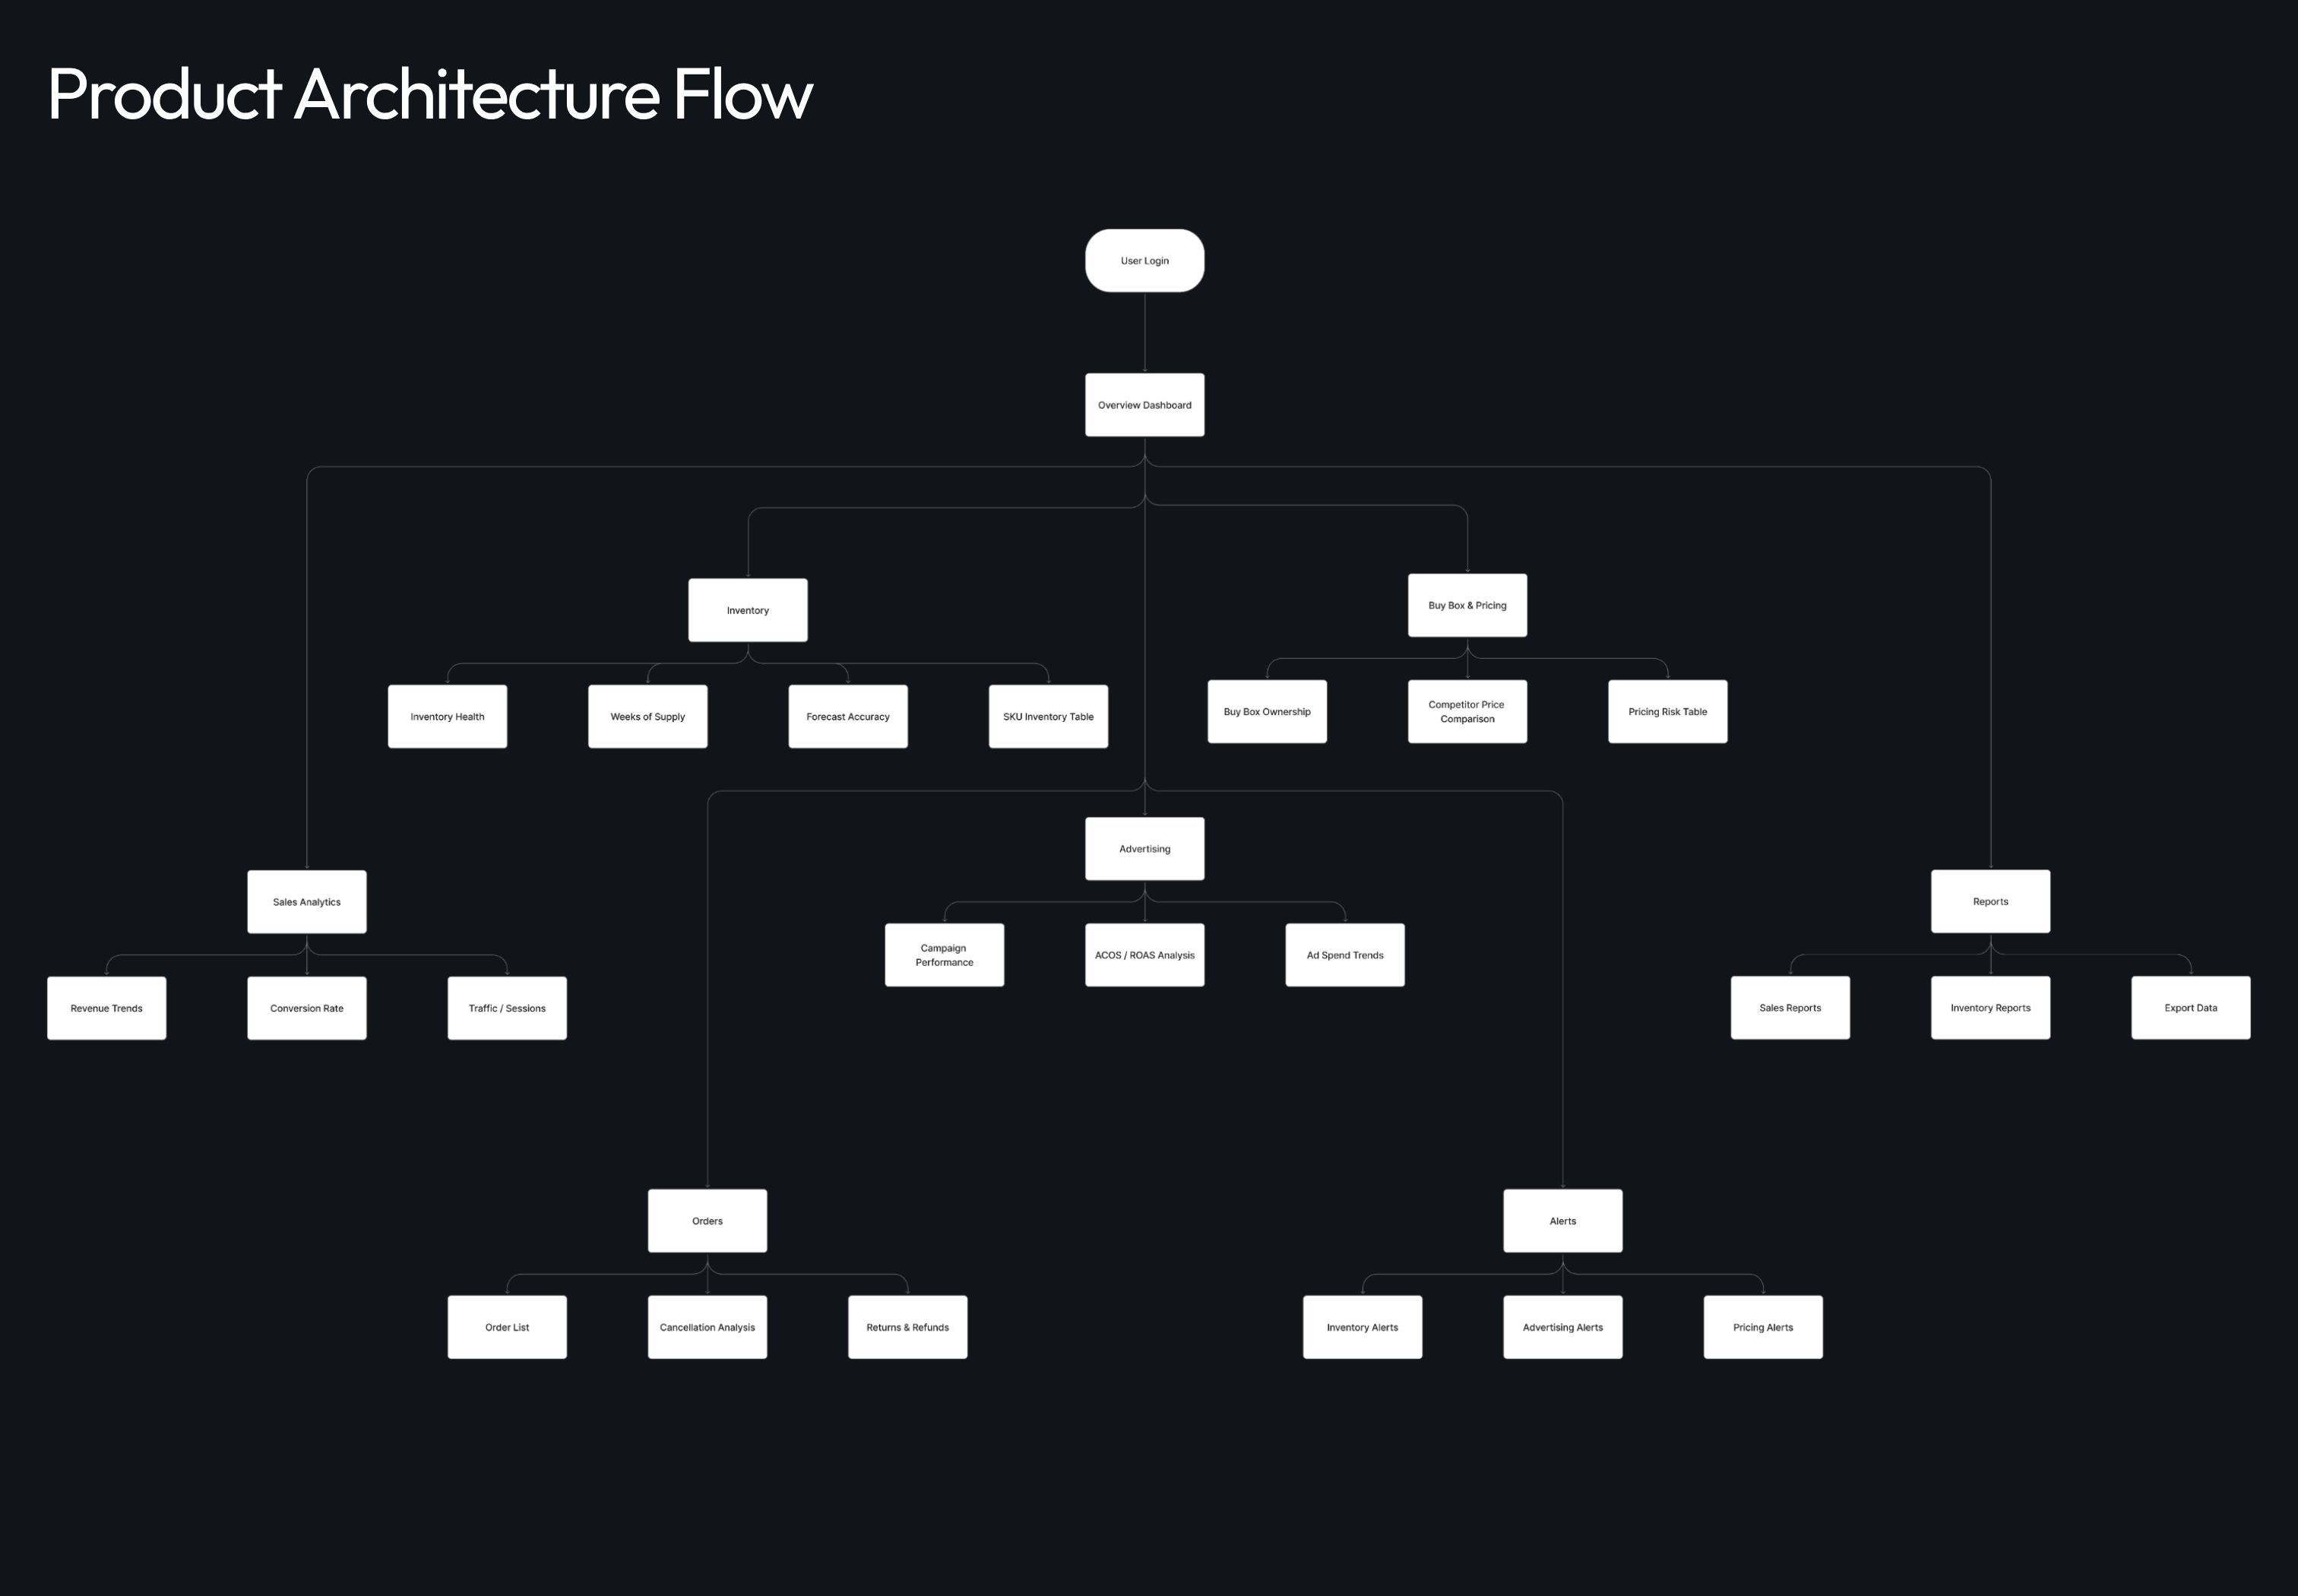
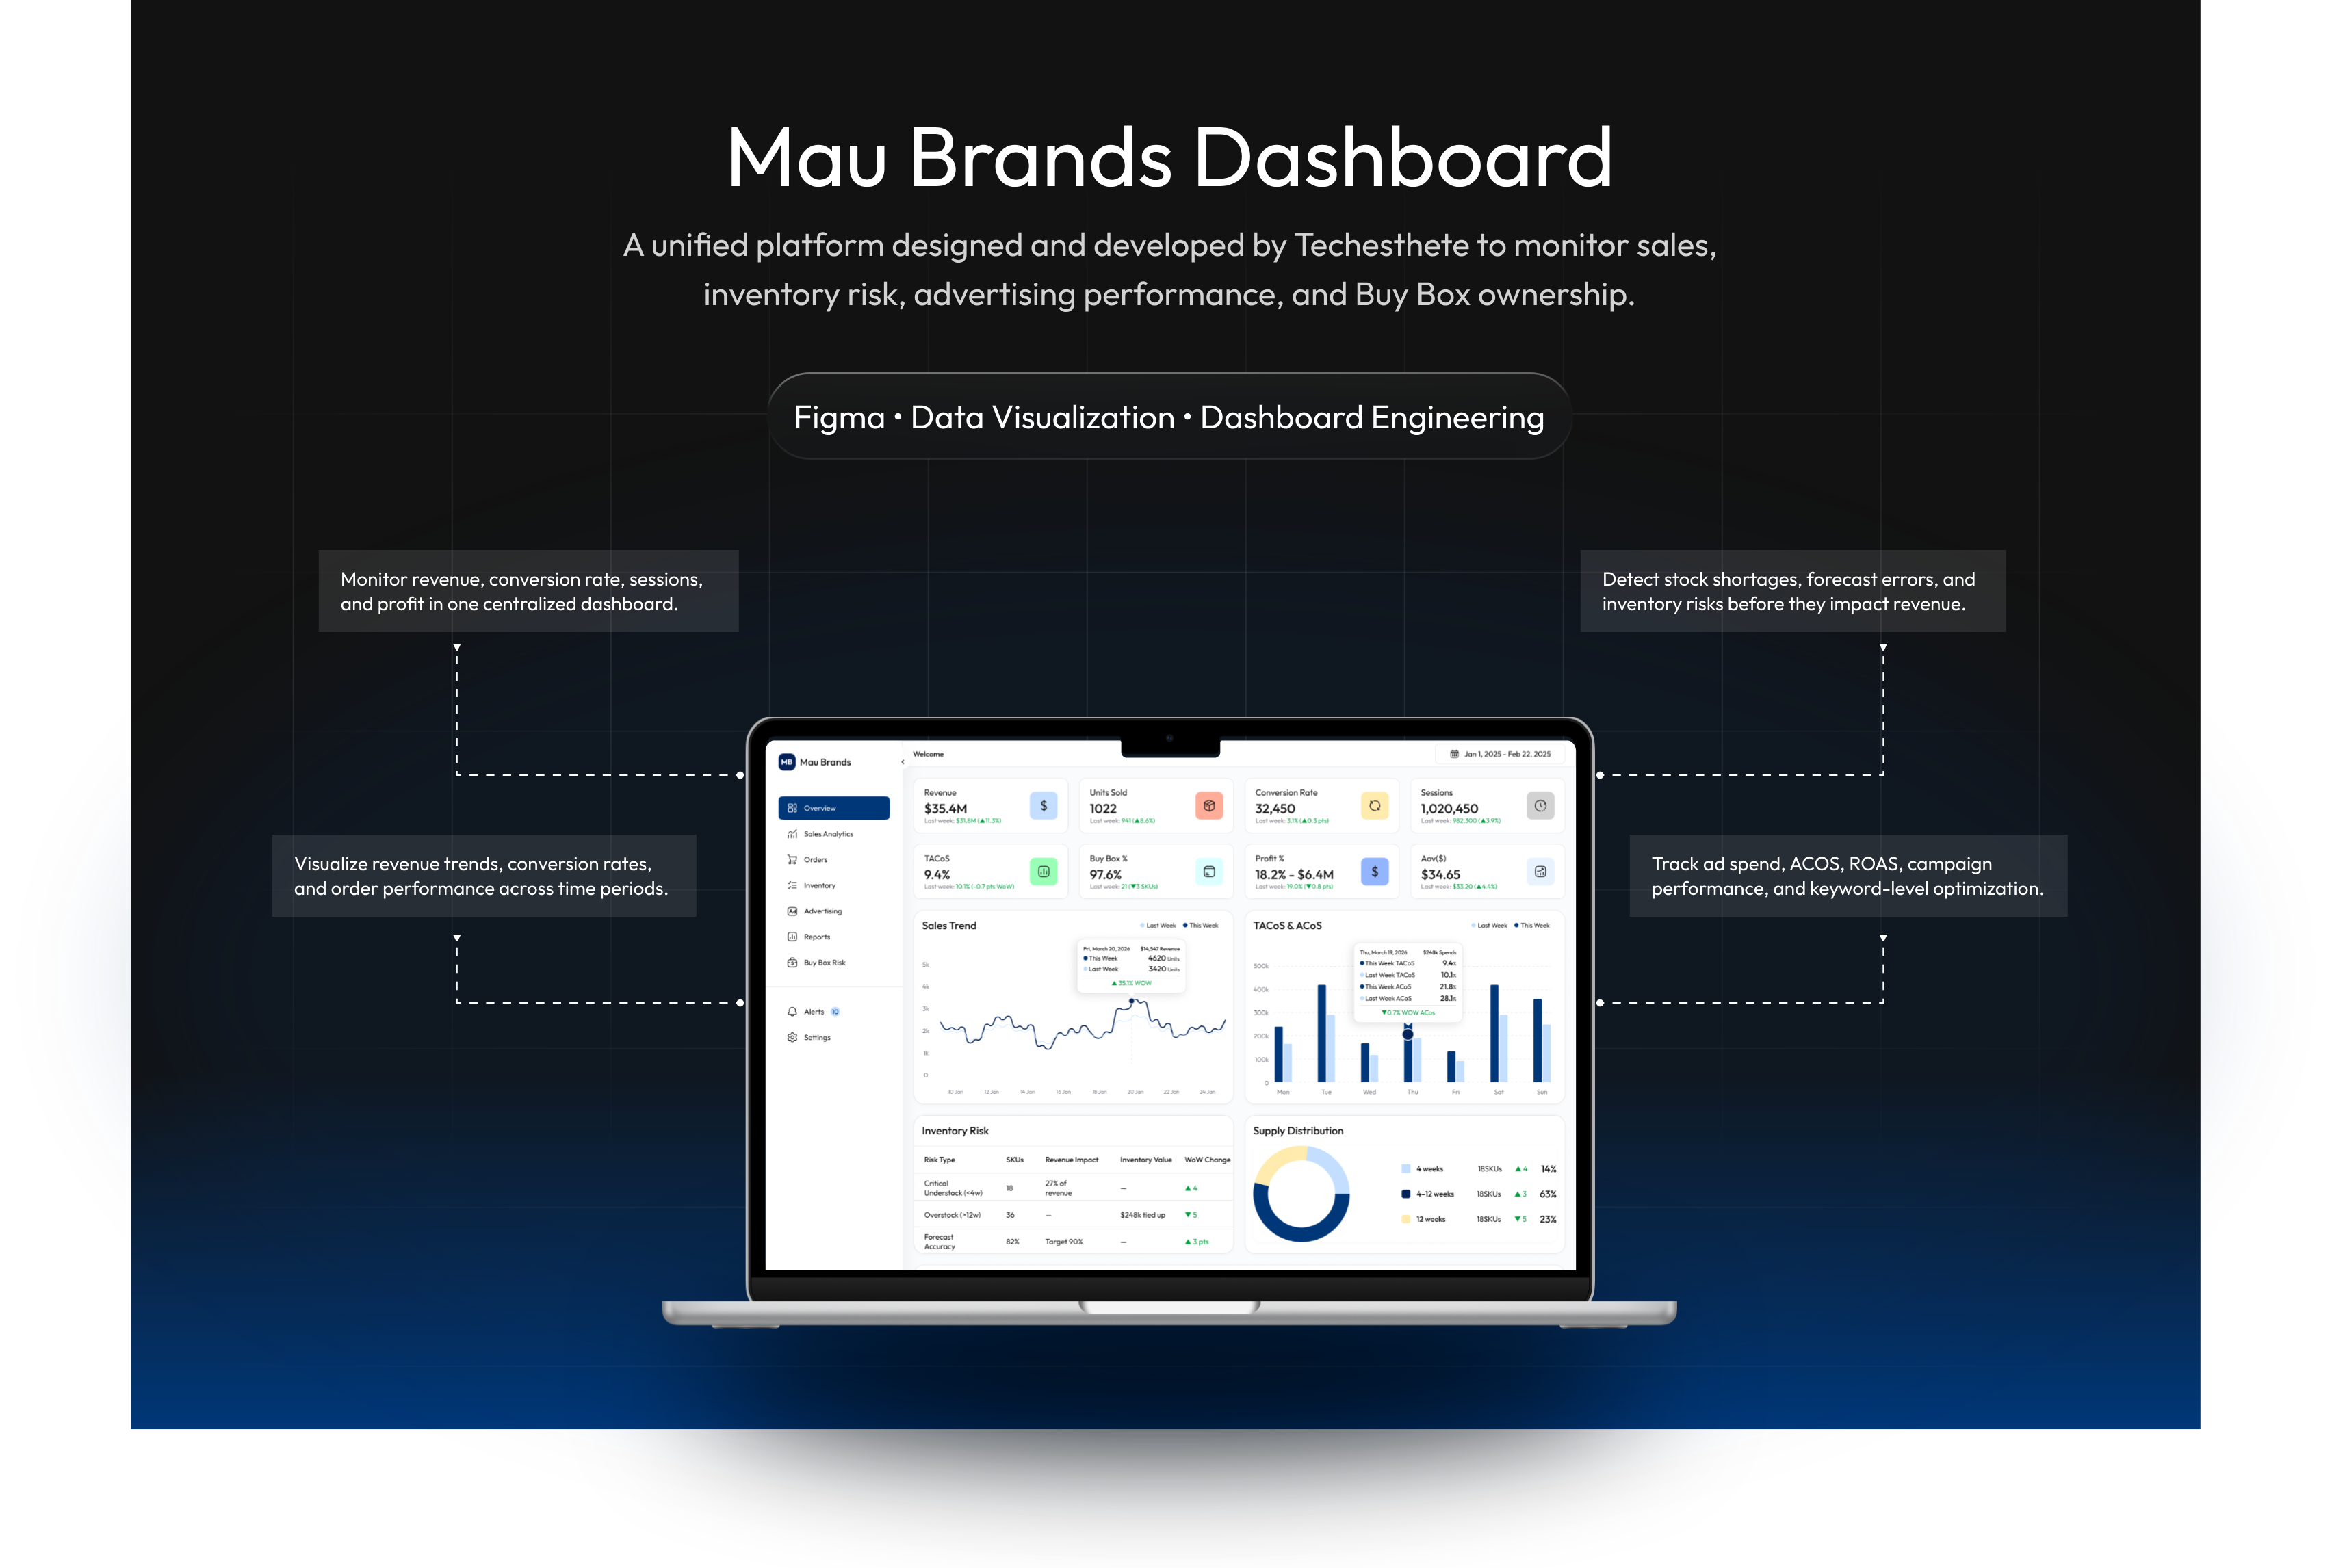
The platform consolidates data from multiple sources including sales, inventory, advertising, and pricing into a single, unified dashboard. Techesthete designed and developed the system to solve key operational challenges such as fragmented data, delayed decision-making, and lack of actionable insights.

Challenge

E-commerce brands and agencies often struggle with data scattered across multiple tools (Seller Central, Ads Manager, spreadsheets), lack of real-time insights for decision-making, difficulty tracking inventory risks and forecasting demand, inefficient campaign optimization due to poor visibility, and Buy Box losses without clear root cause analysis.

These challenges lead to delayed actions, revenue loss, and operational inefficiencies.

What we did

  • Unified Dashboard integrated sales, inventory, advertising, and pricing into a single view
  • Inventory Intelligence built forecasting, Weeks of Supply tracking, and risk detection (understock / overstock)
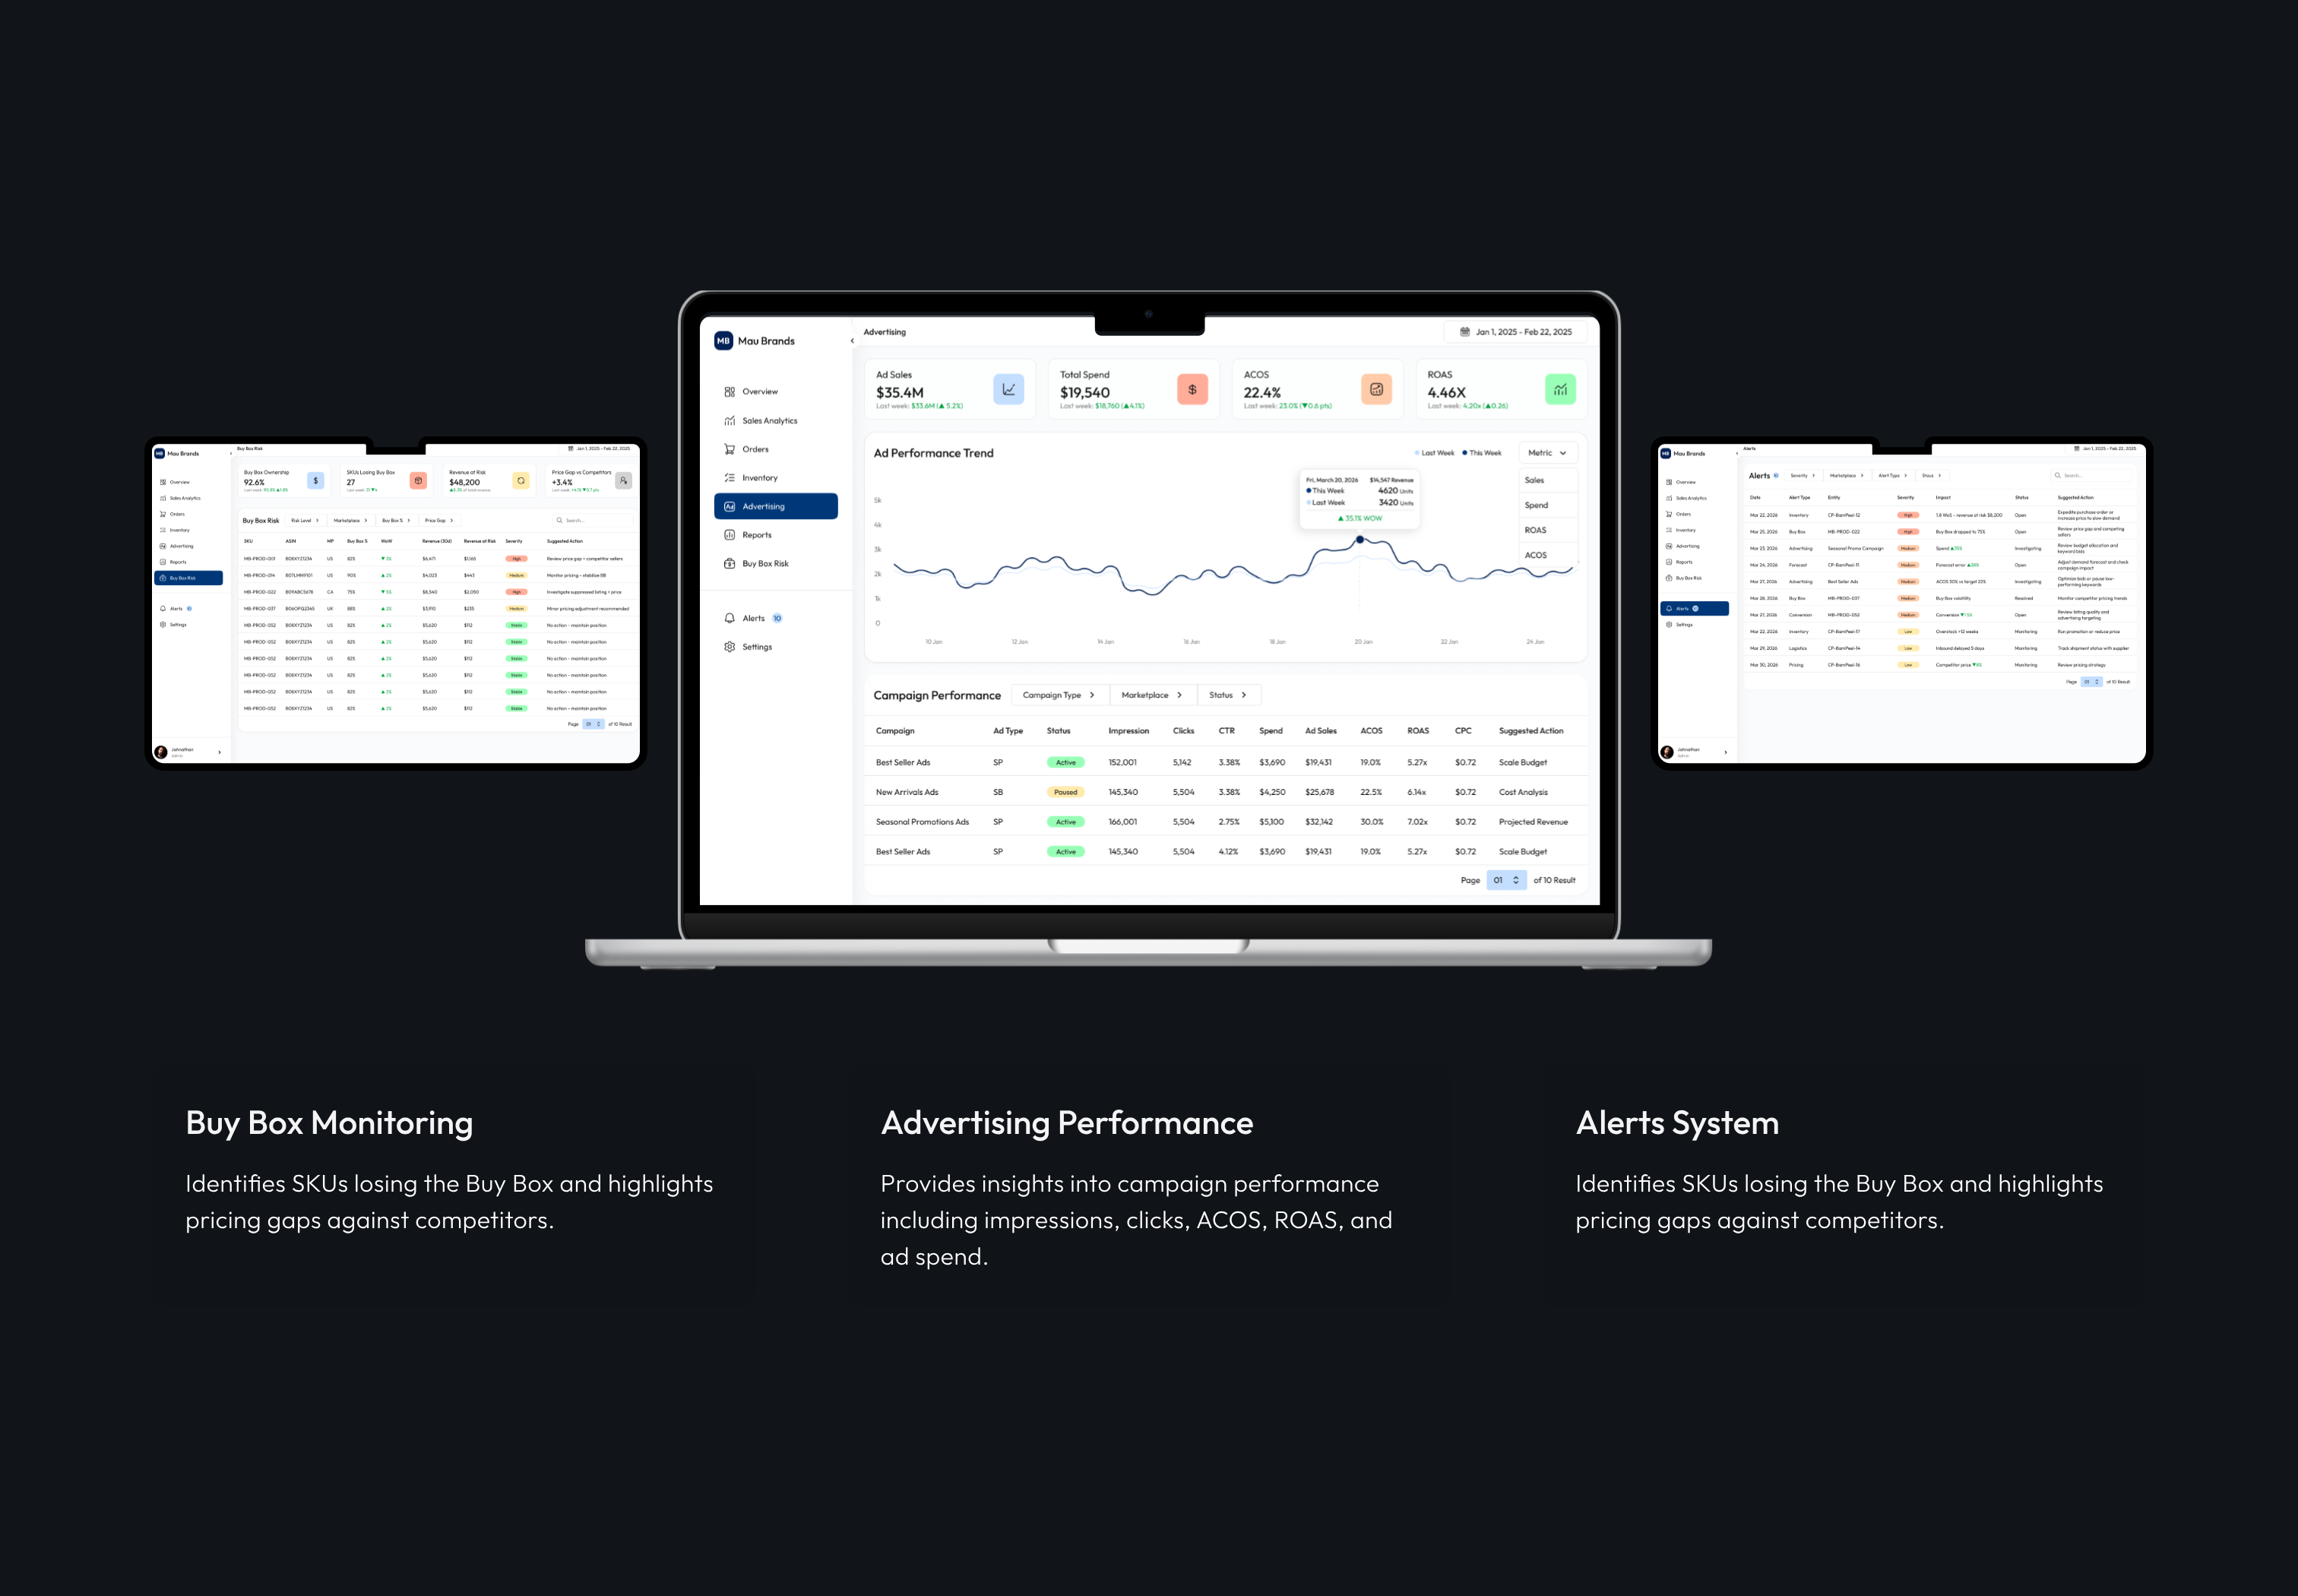
  • Advertising Insights enabled performance tracking for ACOS, ROAS, spend, and campaign efficiency
  • Buy Box Monitoring introduced competitor pricing comparison and Buy Box risk analysis

Techesthete designed and built a centralized analytics platform focused on clarity, speed, and actionability.
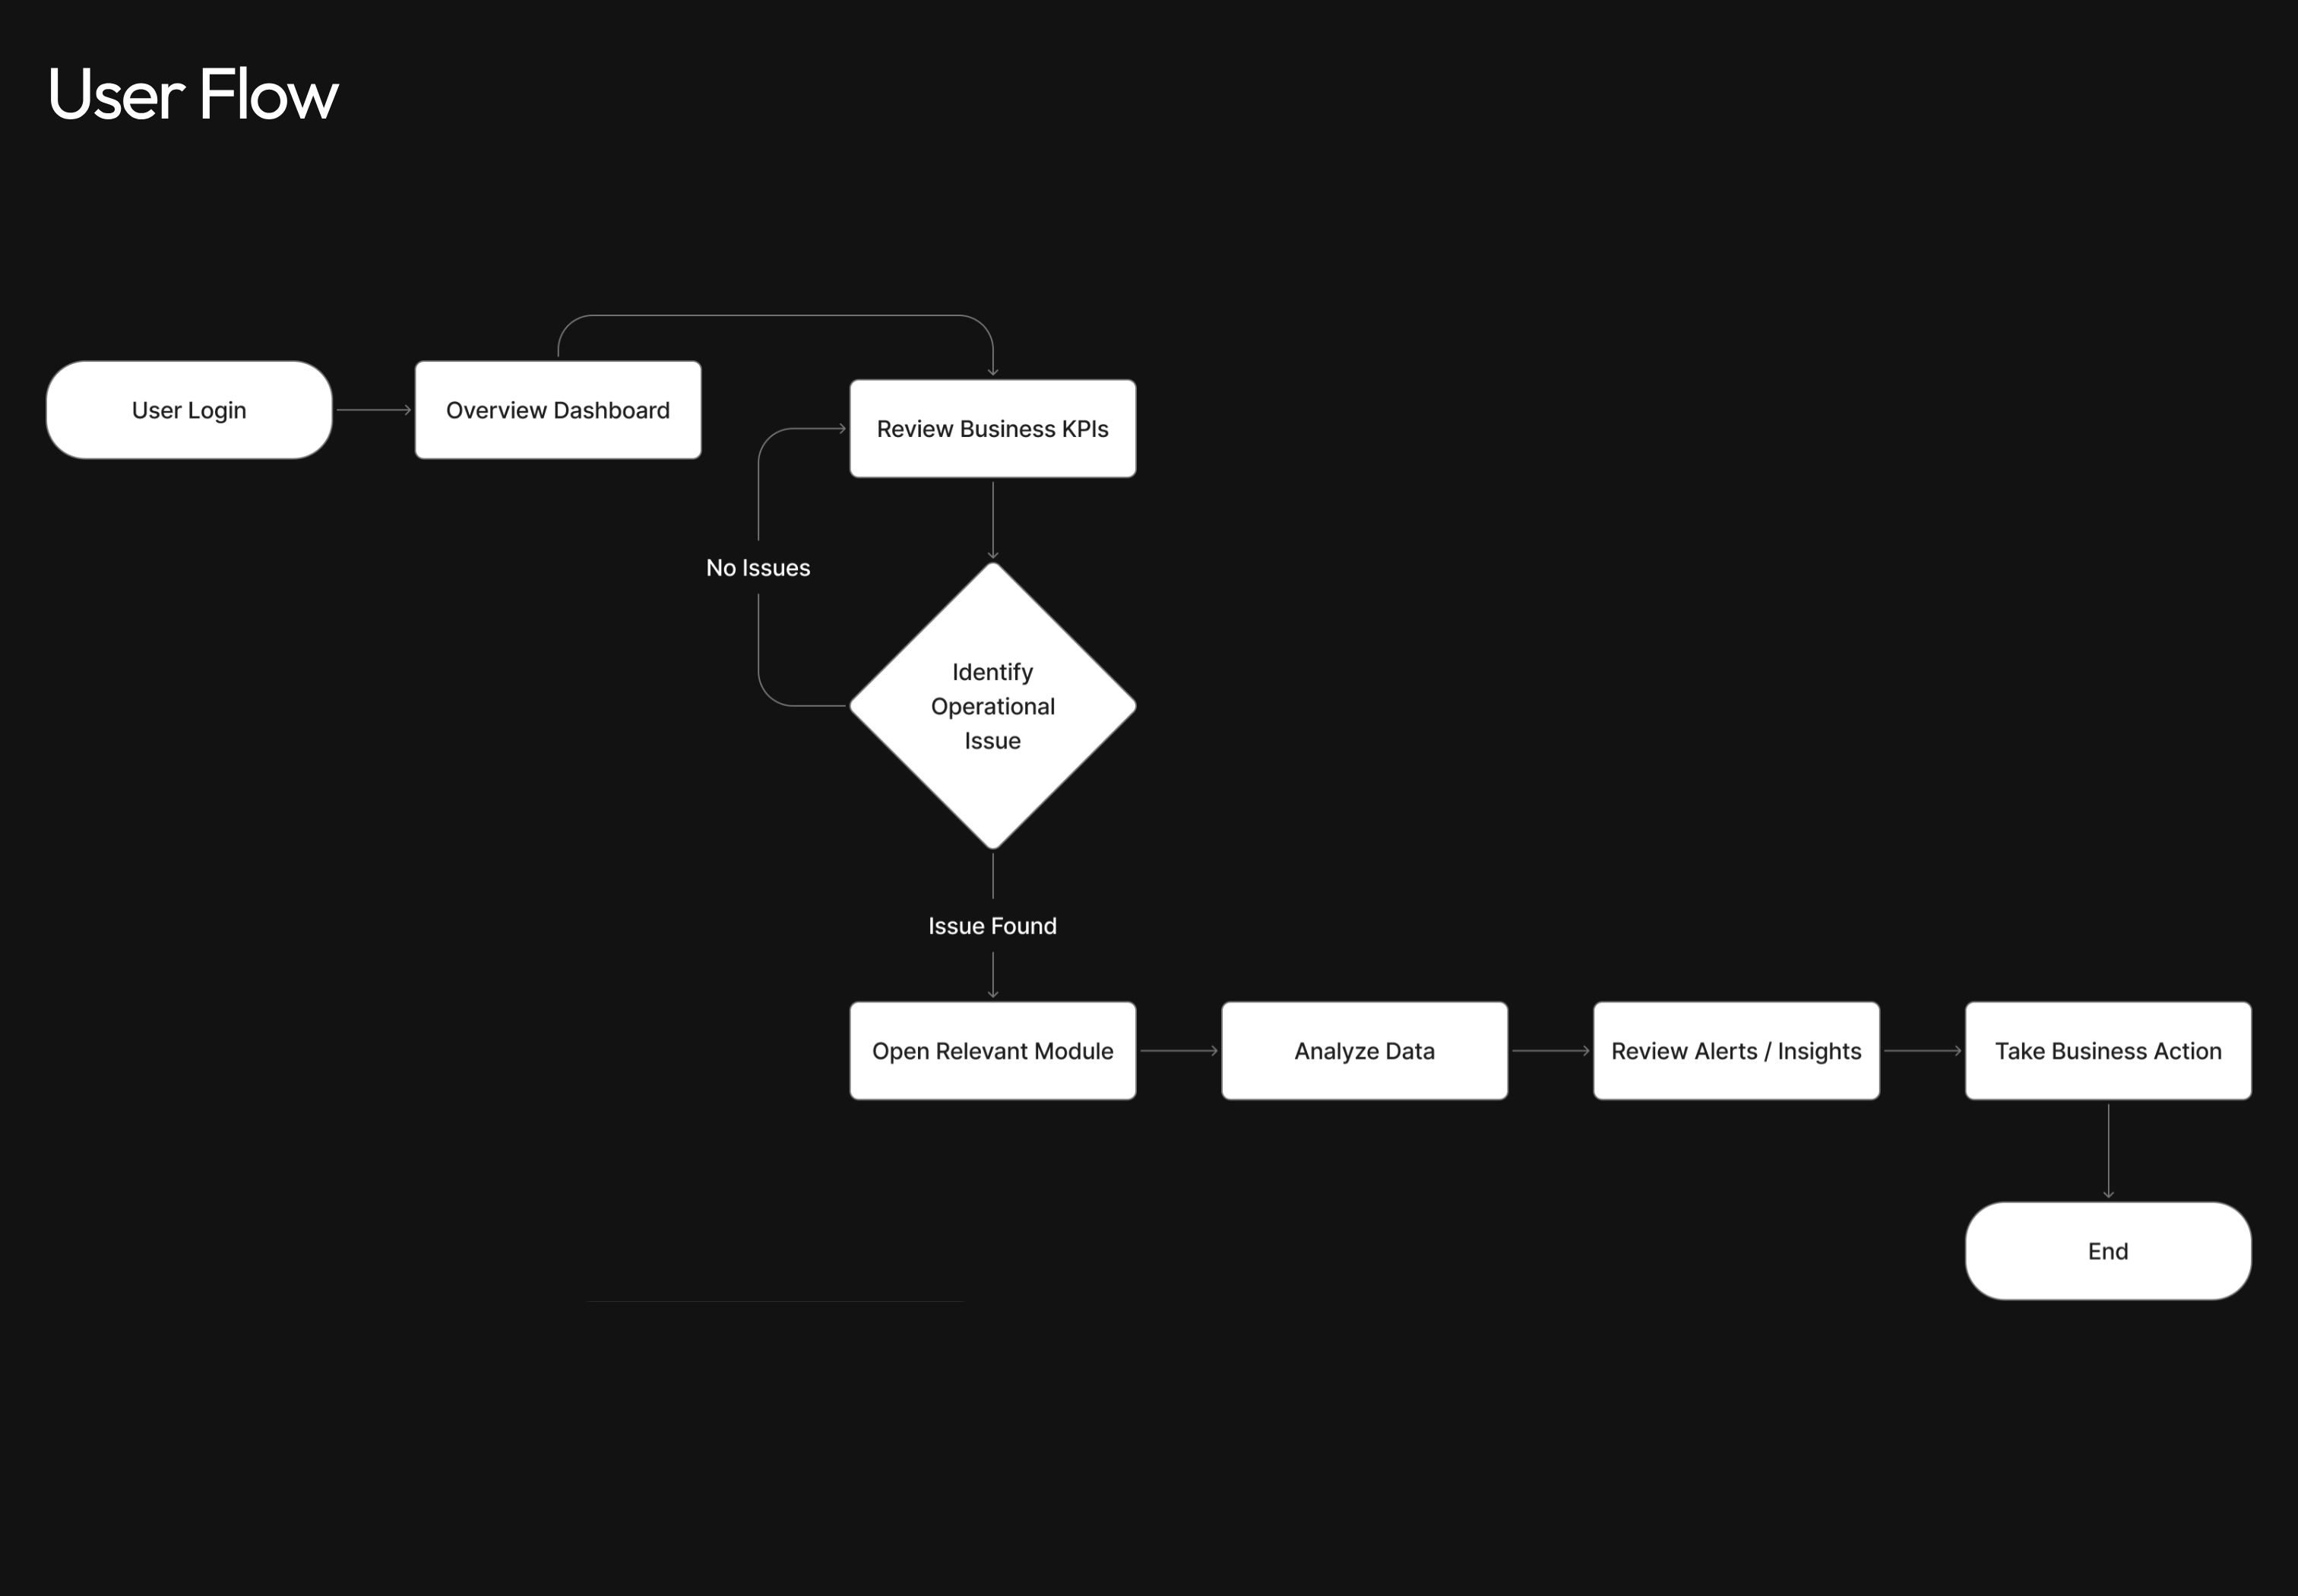
From data ingestion and structuring to visualization, every step was designed to ensure accuracy, scalability, and real-

From data ingestion and structuring to visualization, every step was designed to ensure accuracy, scalability, and real-time decision-making.

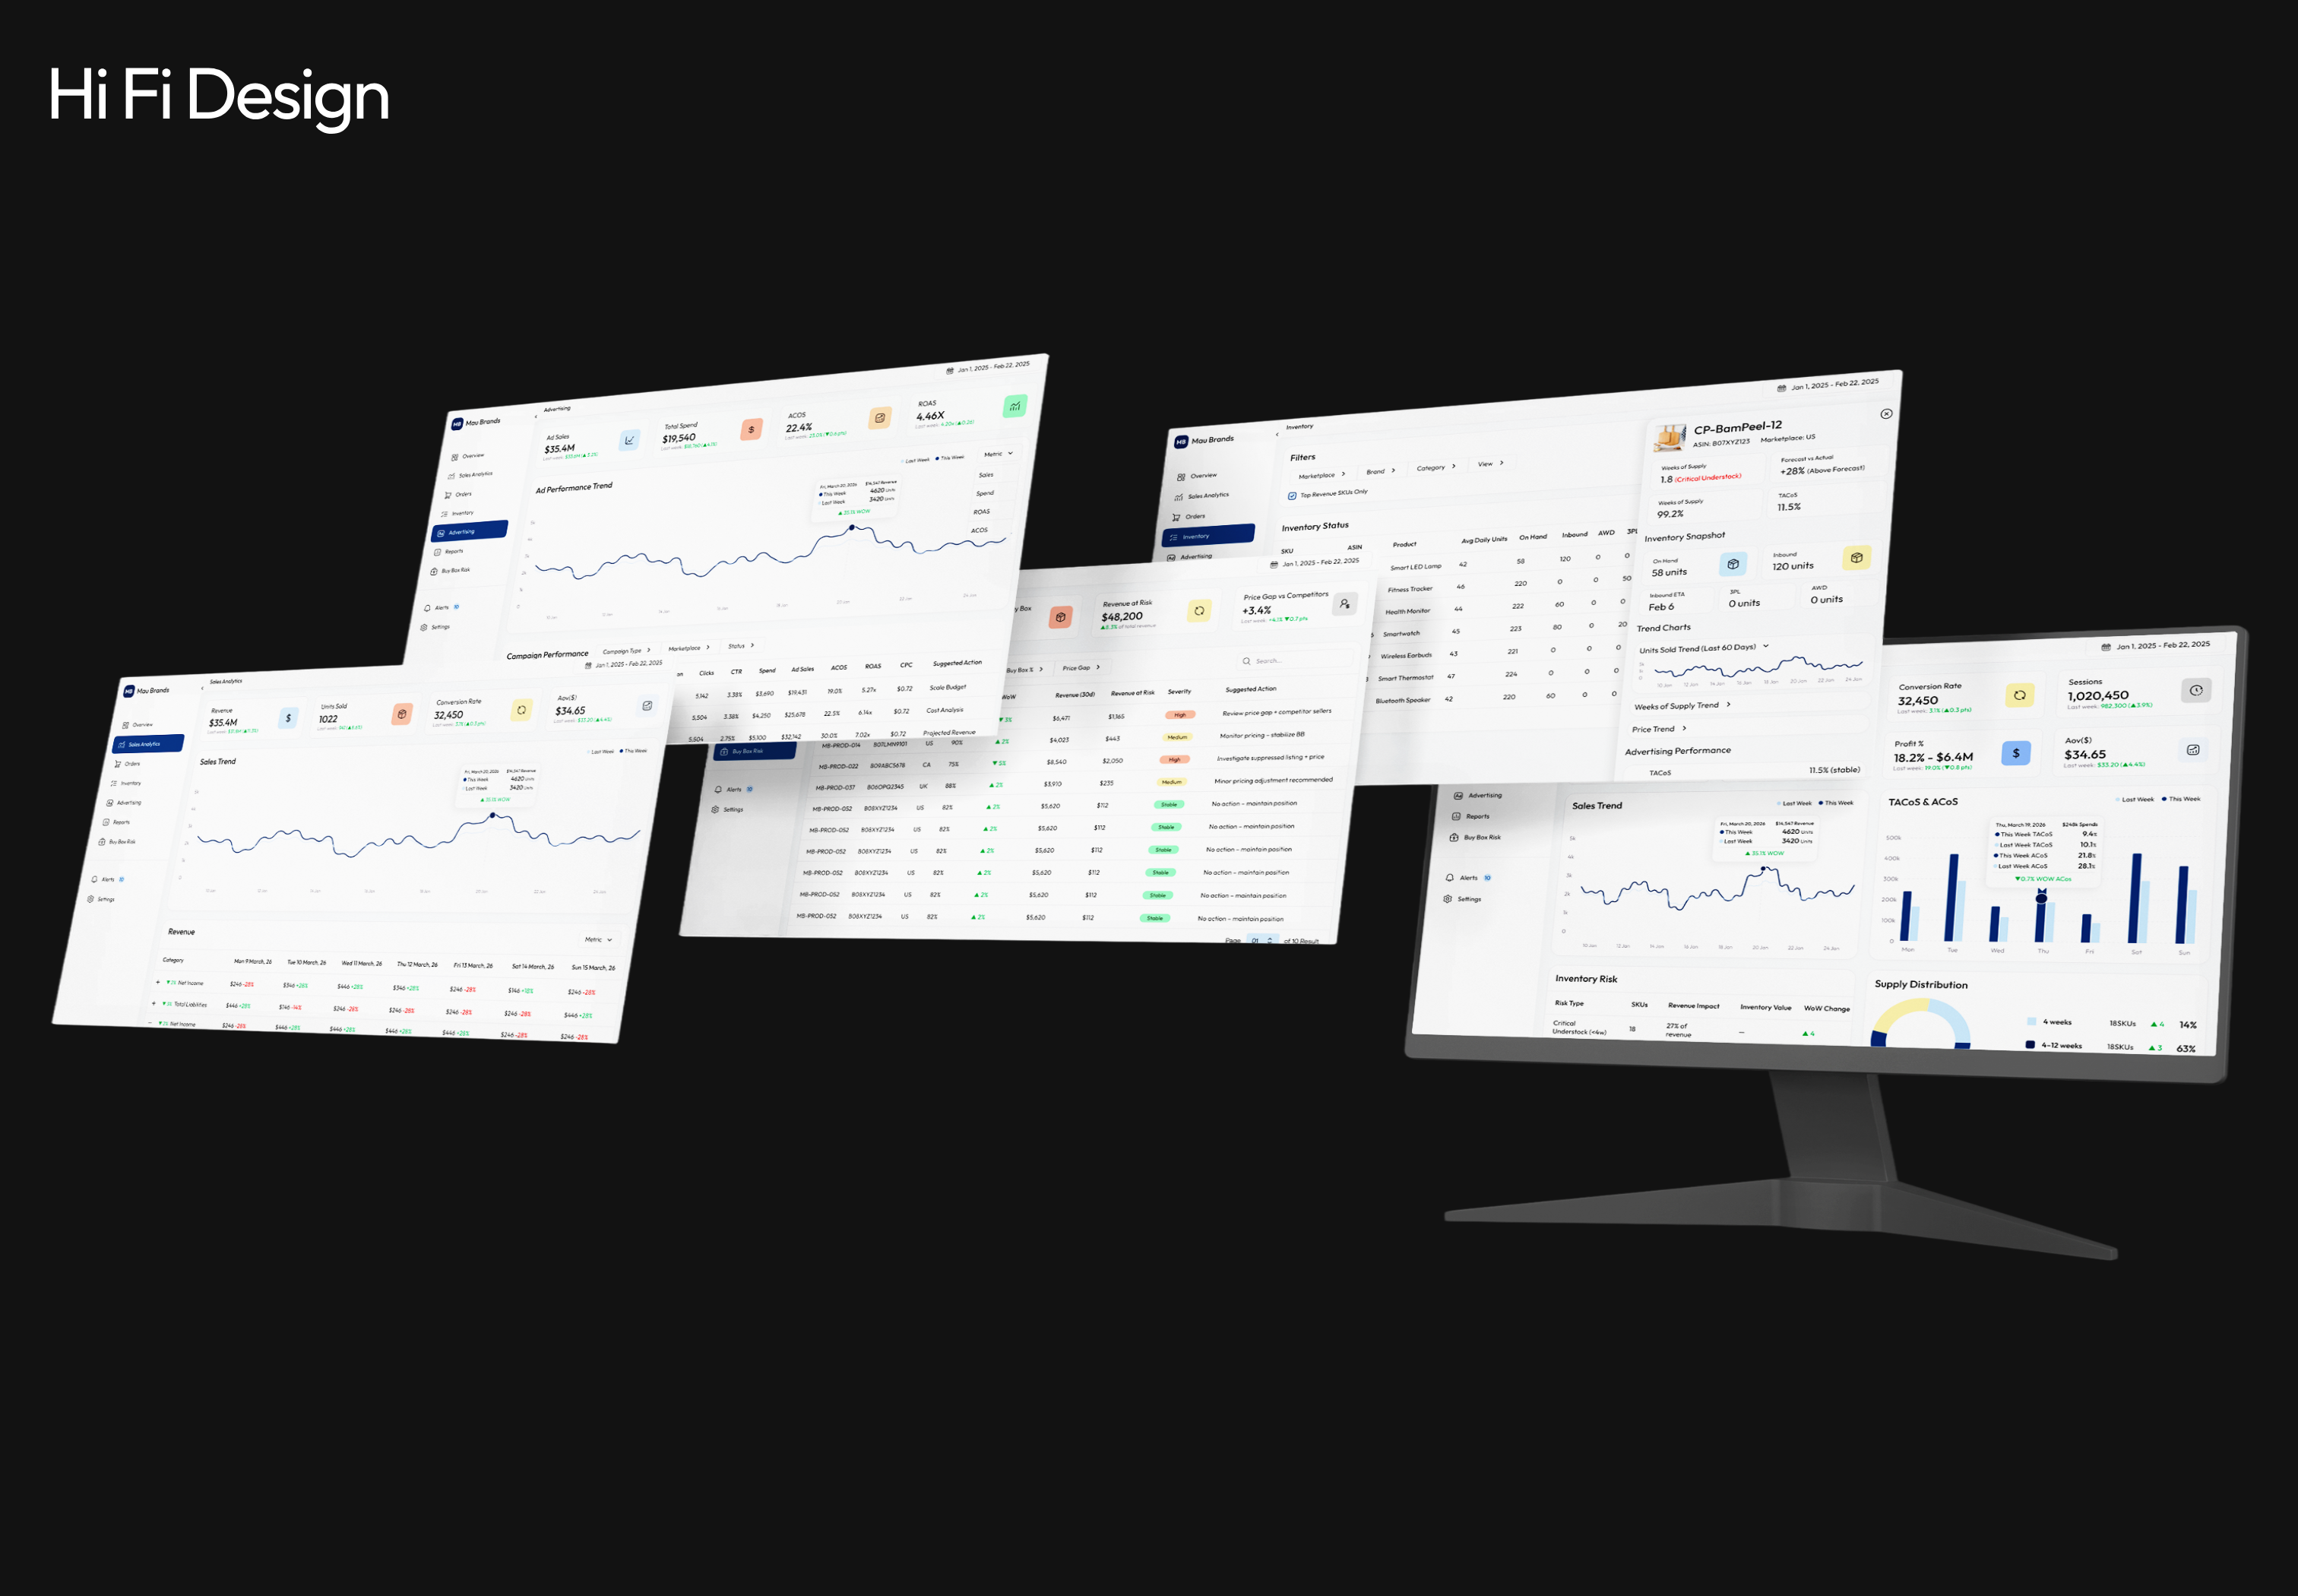
Data is cleaned, modeled, and transformed into actionable dashboards that provide clear insights into performance, risks

Data is cleaned, modeled, and transformed into actionable dashboards that provide clear insights into performance, risks, and opportunities.

Result

Improved decision-making speed with real-time dashboards, reduced dependency on spreadsheets, increased visibility into inventory and revenue risks, and provided scalable analytics infrastructure for growing brands.

40+Increase in operational efficiency through centralized analytics.
25%Reduction in time spent on manual reporting and analysis.
15%Improvement in campaign performance through data-driven decisions.
Mau Brands result visual 1
Mau Brands result visual 2
Mau Brands result visual 3

Stack

Amazon SP-APIAmazon Ads APIETL pipelinesData warehouseBI dashboardsInventory forecastingBuy Box monitoring
Explore more

More work from similar industries and services.

View all case studies